I am an avid fan of ACNH, and one of the regular activities I do daily is to check the turnip prices. Turnip is a commodity in ACNH which you can buy for a random price only on Sundays and sell for the rest of the week–think of this as like a stock exchange.
The prices vary greatly, and one might think that this is random. Well, not completely… There is still some degree of predictability; there is a pattern. There are 4 turnip price patterns in the game: Fluctuating, Large Spike, Decreasing, and Small Spike. Luckily, Ninji (his twitter handle) posted the code, which is written in C++, that governs how turnips are priced in the game. For reference, here’s the code: https://gist.github.com/Treeki/85be14d297c80c8b3c0a76375743325b
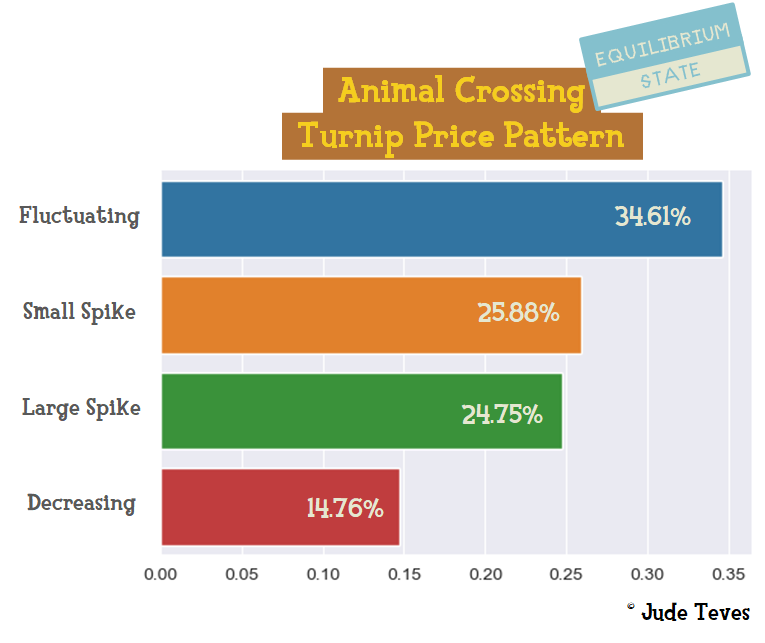
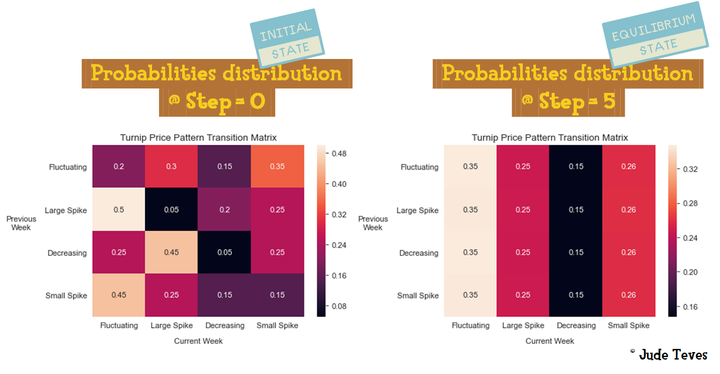
I read the code and got the transition probabilities for each pattern (state). You can see them in the images I have attached. With that data, I treated this as a Markov Chain problem and got the following results: 1. After 5 weeks (states), it will reach the state of equilibrium–which means that cumulative transition probabilities won’t change. 2. On average, the chances of getting a specific pattern are as follows: - Fluctuating - 34.61% - Small Spike - 25.88% - Large Spike - 24.75% - Decreasing - 14.76%
What does this mean?
Assuming that you’ll only buy and sell in your island, if you keep on buying the same amount of turnips every week and sell them when they are at their peak, you’ll gain more on average. #DataScience #acnh #animalcrossing